DMAIC: A Structured Approach to Lasting Process Improvement
Many organizations are very good at solving problems temporarily.
A shipment is delayed, so the team expedites it.
Inventory is short, so an emergency purchase order is issued.
A production line stops, so maintenance repairs the machine.
Warehouse picking errors increase, so employees are reminded to be more careful.
The immediate problem disappears—but a few days or weeks later, it returns.
Why?
Because the organization often treats the symptom rather than the root cause.
This is exactly where DMAIC becomes valuable.
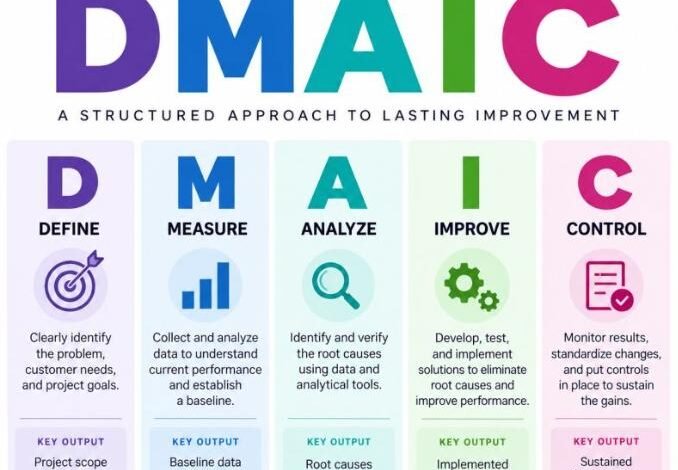
DMAIC is one of the core improvement methodologies used in Six Sigma and Lean Six Sigma to solve existing process problems through data, analysis, structured improvement, and sustained control.
DMAIC stands for:
D – Define
M – Measure
A – Analyze
I – Improve
C – Control
The real power of DMAIC is not in the five letters.
It is in preventing teams from jumping directly from:
“We have a problem” → “Here is the solution.”
Instead, DMAIC forces the organization to understand the problem first.
The Business Problem: Why Improvement Projects Often Fail
A common operational mistake is moving immediately into solution mode.
For example:
“Delivery performance is poor, so we need more trucks.”
But what if the real problem is:
- Late order release?
- Poor route planning?
- Vehicle breakdowns?
- Driver shortages?
- Delayed transporter payments?
- Warehouse loading delays?
- Incorrect customer delivery windows?
Buying more trucks may increase cost without fixing the actual issue.
DMAIC creates a disciplined sequence:
Understand → Measure → Diagnose → Improve → Sustain
1. DEFINE — What Exactly Is the Problem?
The first stage is to clearly define the business problem.
A weak problem statement might be:
“Warehouse performance is poor.”
This is too general.
A stronger DMAIC problem statement would be:
“Warehouse order-picking accuracy declined from 99.4% to 97.2% during the last three months, resulting in increased customer complaints, returns, and rework.”
Now the team knows:
- What happened
- Where it happened
- How large the problem is
- Why it matters
Key Activities in the Define Phase
The team should establish:
- Problem statement
- Business impact
- Customer requirements
- Project scope
- Project objectives
- Stakeholders
- Process boundaries
- Improvement target
Useful tools include:
Project Charter | SIPOC | Voice of Customer | CTQ Analysis | Stakeholder Analysis
Key Output
Clearly defined project scope and measurable problem statement.
2. MEASURE — What Is Really Happening?
Once the problem is defined, the next question is:
What does the data tell us?
Organizations frequently make decisions based on opinions:
- “The supplier is always late.”
- “The warehouse team is slow.”
- “We have too many breakdowns.”
- “Transportation costs are increasing.”
DMAIC converts these statements into measurable facts.
For example:
Instead of:
“Our trucks break down too much.”
Measure:
- Number of breakdowns
- Breakdown hours
- Downtime days
- Maintenance cost
- Failure type
- Vehicle age
- Kilometer reading
- Repeat breakdown rate
Key Activities
- Define performance indicators
- Validate the measurement method
- Collect reliable data
- Establish the current baseline
- Map the current process
- Identify process variation
Useful tools:
Process Mapping | Data Collection Plan | Check Sheet | Pareto Chart | Run Chart | Control Chart
Key Output
Reliable baseline performance data.
3. ANALYZE — Why Is the Problem Happening?
This is one of the most important stages.
The objective is not simply to identify possible causes.
The objective is to verify the real root causes using evidence.
Suppose On-Time Delivery is only 91%, while the company target is 98%.
Possible causes may include:
- Vehicles unavailable
- Late loading
- Order processing delays
- Driver absenteeism
- Route planning problems
- Customer restrictions
- Carrier capacity shortages
The team should not assume which one is responsible.
It must analyze the data.
Useful Root-Cause Tools
5 Whys
Ask “Why?” repeatedly until the underlying cause becomes visible.
Fishbone Diagram
Analyze potential causes under categories such as:
People | Process | Machine | Material | Measurement | Environment
Pareto Analysis
Identify the few causes responsible for the majority of the problem.
Data Analysis
Compare:
- Locations
- Suppliers
- Vehicles
- Products
- Shifts
- Drivers
- Customers
- Time periods
Key Output
Verified root causes—not assumptions.
4. IMPROVE — Fix the Root Cause
Only after understanding the root cause should the organization design the solution.
For example, if delivery delays are mainly caused by long warehouse loading times, buying additional trucks would not address the root cause.
Instead, improvement actions may include:
- Pre-picking orders
- Appointment scheduling
- Dock allocation
- Loading sequence optimization
- Standard loading procedures
- Additional loading equipment
- Shift rescheduling
Improvement Process
A strong Improve phase should follow:
Generate Solutions → Evaluate → Prioritize → Pilot → Measure → Implement
Do not roll out a major change across the entire business before testing it where possible.
Use a pilot first.
Key Output
Implemented and validated improvements.
5. CONTROL — Make Sure the Improvement Lasts
This is where many improvement projects fail.
Performance improves temporarily, management attention shifts elsewhere, and the old problem slowly returns.
DMAIC therefore includes Control.
The question becomes:
How do we ensure the improved process remains improved?
Control mechanisms may include:
- KPI dashboards
- Standard operating procedures
- Daily visual management
- Control charts
- Audits
- System alerts
- Process ownership
- Responsibility matrices
- Monthly performance reviews
- Corrective-action triggers
Key Output
Sustained performance and ongoing monitoring.
Practical Supply Chain Example
Suppose a company has the following problem:
Current Situation
On-Time Delivery = 91%
Target:
≥98%
Instead of immediately increasing transportation capacity, the company applies DMAIC.
DEFINE
Problem:
Delivery performance has remained below target for three consecutive months.
Business impact:
- Customer complaints
- Lost sales
- Penalties
- Additional transportation cost
MEASURE
Collect:
- Dispatch time
- Loading duration
- Vehicle availability
- Delivery arrival time
- Driver availability
- Distance
- Breakdown incidents
- Customer waiting time
ANALYZE
Pareto analysis reveals:
- 42% — Late warehouse loading
- 25% — Vehicle breakdown
- 18% — Carrier shortage
- 10% — Route planning
- 5% — Other
Now the organization understands where improvement effort should be concentrated.
IMPROVE
Actions:
- Introduce loading appointments.
- Pre-stage high-volume orders.
- Improve preventive maintenance.
- Create backup carrier capacity.
- Optimize routes digitally.
CONTROL
Monitor weekly:
OTD | Loading Time | Fleet Availability | Breakdown Rate | Carrier OTIF
If performance falls below the defined threshold, corrective action begins immediately.
This is the difference between problem solving and process management.
DMAIC KPIs
The KPIs depend on the process being improved, but every DMAIC project should measure both the business result and the process drivers.
| KPI | Formula / Measurement | Purpose |
|---|---|---|
| Defect Rate % | Defective outputs ÷ Total outputs × 100 | Measures process quality |
| First Pass Yield % | Correct first-time outputs ÷ Total outputs × 100 | Measures process effectiveness |
| Cycle Time | Process completion time − Start time | Measures speed |
| On-Time Delivery % | On-time deliveries ÷ Total deliveries × 100 | Measures delivery reliability |
| OTIF % | On-Time & In-Full orders ÷ Total orders × 100 | Measures service performance |
| Process Compliance % | Compliant activities ÷ Activities audited × 100 | Measures adherence |
| Cost of Poor Quality | Scrap + Rework + Returns + Failure costs | Measures financial impact |
| Rework Rate % | Reworked transactions ÷ Total transactions × 100 | Identifies inefficiency |
| Downtime % | Downtime ÷ Available operating time × 100 | Measures asset availability |
| Improvement Sustainability % | Periods meeting target ÷ Periods monitored × 100 | Confirms results are maintained |
Recommended DMAIC Project KPI Structure
A professional improvement project should use three levels of KPIs.
Level 1 — Business Outcome KPI
Examples:
Cost | Service Level | Productivity | Quality | Customer Satisfaction
Level 2 — Process KPI
Examples:
Cycle Time | Loading Time | Picking Accuracy | Procurement Lead Time
Level 3 — Driver KPI
Examples:
Breakdown Rate | Supplier Delay | Order Release Delay | Employee Productivity
This creates a clear relationship:
Root Cause → Process Performance → Business Result
Example: Warehouse DMAIC Project
Problem
Picking accuracy = 96.5%
Target = 99.5%
Root Causes Identified
- Similar-looking SKUs
- Incorrect storage locations
- Manual confirmation
- Weak location labels
Improvements
- Barcode verification
- Location redesign
- SKU separation
- Scanner confirmation
- Employee training
Control KPIs
- Picking Accuracy ≥ 99.5%
- Picking Error Rate ≤ 0.5%
- Rework Rate ≤ 1%
- Inventory Accuracy ≥ 99%
The important point is that targets should be based on your business requirements and validated baseline—not copied blindly from another company.
Common Mistakes When Using DMAIC
1. Starting With the Solution
“We already know the problem.”
Often, the organization knows the symptom rather than the cause.
2. Collecting Too Much Data
Measure what helps explain the problem—not everything available in the system.
3. Using Opinions Instead of Evidence
A root cause must be validated.
4. Implementing Too Many Actions
Prioritize the few improvements that address the major causes.
5. Ignoring the Control Phase
Without ownership, KPIs, standards, and monitoring, performance may return to its previous level.
DMAIC vs PDCA
Both are valuable improvement methodologies.
PDCA — Plan, Do, Check, Act
is often excellent for ongoing and relatively straightforward continuous improvement.
DMAIC
is generally more structured and data-driven, making it highly useful for complex recurring problems where the root cause is not immediately clear.
DMAIC vs DMADV
Another important distinction:
DMAIC is mainly used to improve an existing process.
When an organization needs to design an entirely new process, product, or service, Six Sigma may instead use DMADV:
Define → Measure → Analyze → Design → Verify
Choosing the right methodology matters.
Management Dashboard for DMAIC Projects
Senior management should be able to see:
Project | Problem | Baseline | Target | Current Performance | Root Cause | Improvement Actions | Financial Benefit | Owner | Status | Control KPI
This turns continuous improvement from a collection of isolated initiatives into a managed improvement portfolio.
Final Takeaway
DMAIC is not simply a Six Sigma acronym.
It represents a management discipline:
**Define before acting.
Measure before assuming.
Analyze before blaming.
Improve the root cause.
Control before declaring success.**
Organizations that follow this discipline reduce firefighting and build processes that are measurable, predictable, efficient, and sustainable.
The goal is not merely:
“Solve today’s problem.”
The stronger objective is:
“Understand why the problem occurred, eliminate the root cause, and build a process that prevents it from returning.”
That is the real value of DMAIC and continuous improvement.
By ENG. Jamal Ahmed
Supply Chain & Business Transformation